Everyone uses EMA 200. Open ten different trading channels and you'll hear the exact same generic line: “price is above EMA 200, so we're in buy; price is below, so we're in sell.” That's not a trading system — that's a coin flip with extra steps.
Here's what I actually teach my students: EMA 200 isn't a signal by itself. It's a filter. The real entry comes from a very specific candle sequence around it — one that either confirms a setup is alive or tells you instantly that it's dead. Once you can read that sequence, EMA 200 stops being a lagging line on your chart and starts being one of the most repeatable systems you'll ever trade.
Masterclass Live Proof
“I built this entire lesson on the BTCUSDT chart, on the 1-day timeframe, backtesting real price action candle by candle. Let me walk you through exactly what I showed.”
The Rule, Broken Down (Sell-Side Mechanics)
Here's the sell-side version — buy is just the clean mirror image of this logic.
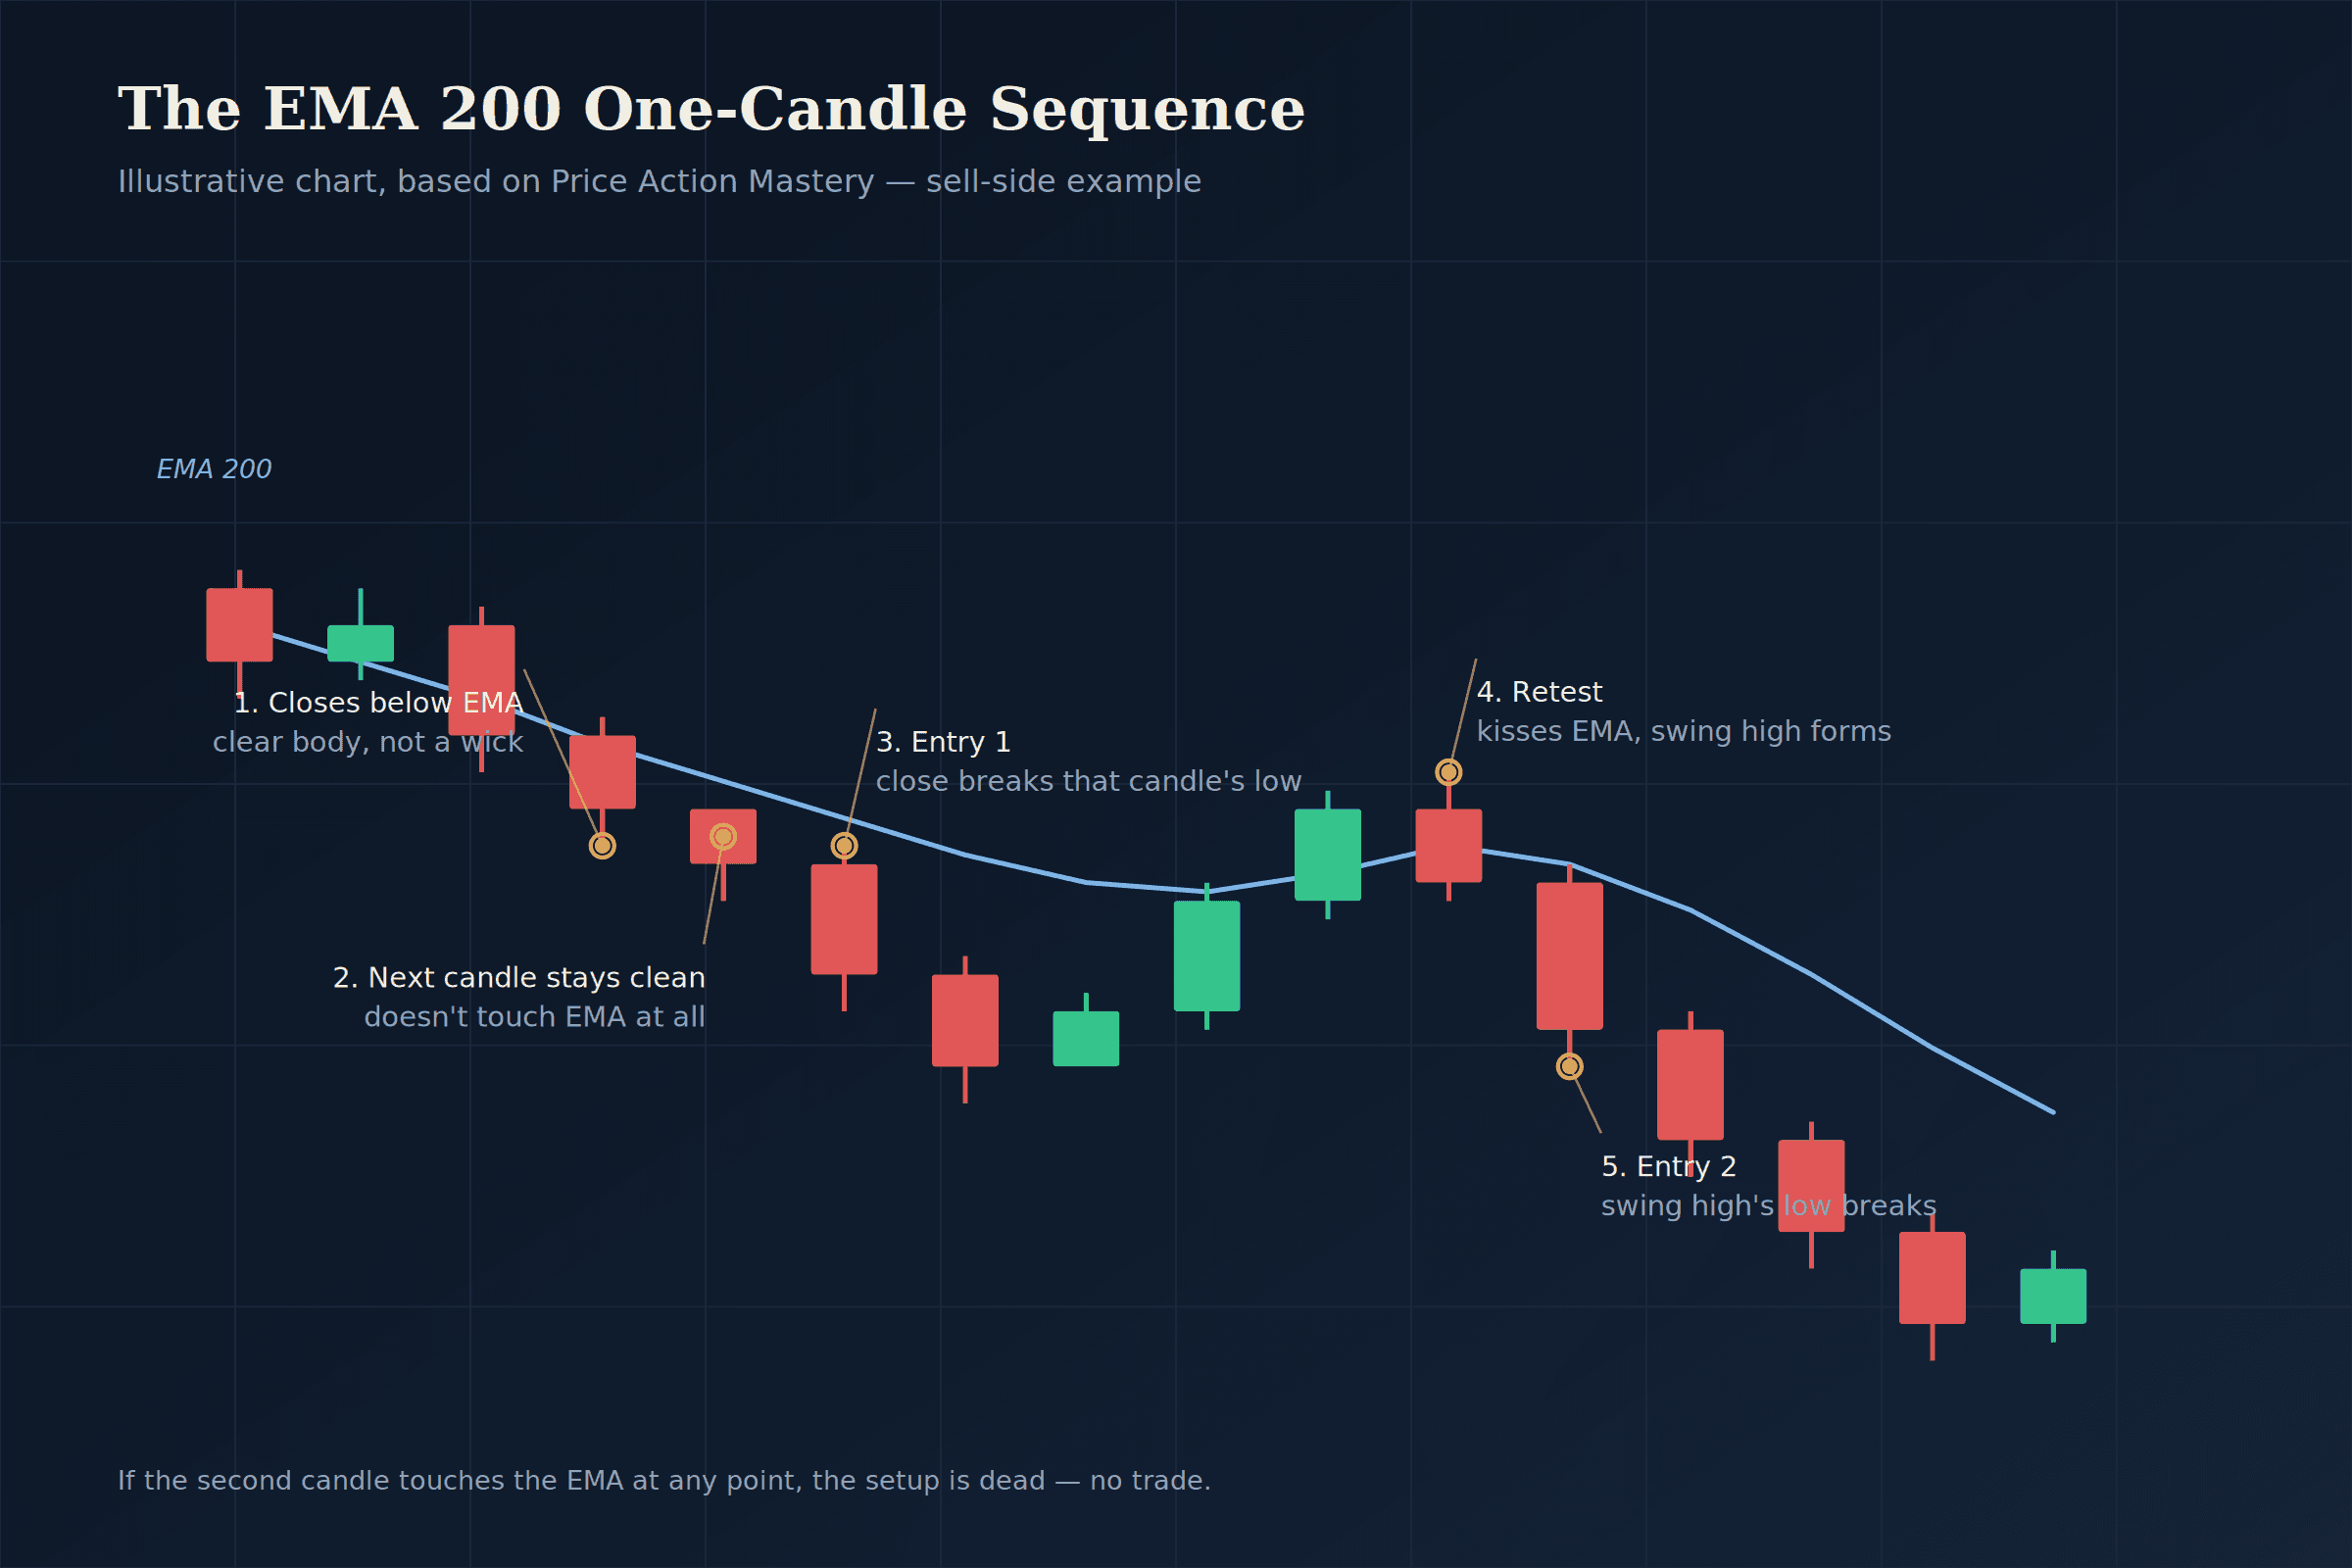
Price is trending down, sitting below EMA 200. A candle closes below the EMA with a clear body — not a wick poking through, an actual close. That's step one.
The next candle must not touch the EMA at all. Not the wick, not the body — nothing. If it touches, the setup is dead. Full stop. You don't force it, you don't wait around hoping it resolves.
The Entry & Stop Loss Execution:
If that second candle stays clean and untouched, you mark its low. The moment a later candle closes below that low, that is your first entry.
Your stop loss sits directly above the swing high that confirms the setup — not an arbitrary pip number, but an actual structural price point.
You Often Get a Second Chance (The Retest Kiss)
Sometimes price moves too fast and you miss that first entry. That's fine — EMA 200 setups usually aren't a one-shot opportunity.
The EMA Retest & Swing High Entry
What you do instead is wait for price to come back and “kiss” the EMA again. If it forms a proper swing high there — the exact same swing high concept taught in Class 01 — you wait for that swing point to get confirmed and broken, and that's your second entry.
This is exactly why Class 1 matters before this lesson makes any sense. Swing points aren't just theory — they're literally where your second entry and risk parameters come from.
BTCUSDT Backtesting: Live Chart Breakdown
Below is the exact chart analysis from the masterclass demonstration. Notice how the candle isolation and the retest kiss create high-conviction entries while instantly disqualifying fakeouts:
The Rule You're Not Allowed to Break
This is the part I want you to actually sit with: if the higher timeframe is in a sell, you only take sells on your entry timeframe. Even if a textbook-perfect buy setup forms right in front of you on the 1-hour chart — you skip it without hesitation.
Sajjad Riaz's Strict Law of Bias:
“I said this directly while backtesting: I will not trade against the full timeframe, even if someone offers me a 1:10 reward-to-risk on the other side. That's not stubbornness. It's the entire point of timeframe alignment from Class 1 — the daily chart is the grandfather in the room, and you don't override the grandfather because a 1-hour candle looks tempting.”
“Trend is your friend” gets thrown around a lot in trading education, and honestly, I don't fully buy that phrase — nobody can predict where price goes next. What I trade instead is bias: the direction the higher timeframe has already confirmed, using the exact EMA 200 rules above. Bias isn't a guess. It's a rule you already proved on a bigger timeframe.
What Backtesting This Actually Looks Like
I didn't cherry-pick winning trades for this lesson. I went candle by candle on the live BTC chart and called setups exactly as they appeared — including the ones that failed.
A setup where the second candle touched the EMA with its wick — declared dead on arrival, no trade taken.
A sell that triggered on a clean retest with a tight swing high stop loss, running to a 1:5 or better reward.
Price wicked into the stop loss zone but never closed there — the trade survived and continued into target.
Multiple sequential entries off the same daily trend taken on the 1-hour chart, each with its own swing point.
That last part is the real value of this system. EMA 200 doesn't give you one trade per trend — it gives you several, as long as you're patient enough to wait for the candle sequence to actually form instead of jumping in because price is “near the line.”
Why This Matters Before You Trade It Live
None of this works if you skip Class 1. Swing highs, swing lows, and timeframe alignment aren't separate topics — they're the components this entire EMA 200 system is built from:
Your Assignment: Candle-by-Candle Backtesting
Put a chart in front of you (BTCUSDT or any major index), mark EMA 200 on the Daily chart, and start going candle by candle yourself. Find where a candle closes through it, check whether the next one stays completely clean, and watch what happens after. That's the whole exercise at this stage — nothing more, nothing less.